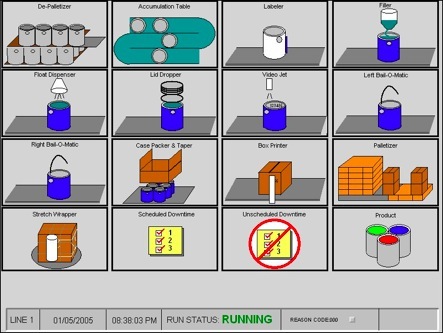
Application Example 1: A manufacturing company needed
an easy way to automatically monitor the performance of each
piece of equipment in the plant. Nebula designed an easy-to-
use touch screen with an icon for each machine, displaying
the desired data. The collected data is exported daily to a
Nebula customized spreadsheet that seamlessly collates the
data and creates a daily report.
Application Example 2: A major paint manufacturer
needed an operator-friendly method of collecting reasons
for downtime on several production lines. Nebula designed
a graphical interface, displaying each area on the machine.
When a stoppage occurred, the operator simply selected
the icon corresponding to the reason for downtime. The
system automatically collected the critical statistics and
provided a daily report.


